AI Search Benchmark Framework for Teams

Direct answer: An AI search benchmark framework is a repeatable way to measure your brand’s starting position across AI search results before you set targets or change content. Build it by defining the business question, grouping prompts by intent, selecting competitors and platforms, capturing response evidence, and scoring mentions, citations, share of voice, prominence, and sentiment on a fixed cadence.
An AI search benchmark framework gives teams a stable baseline for AI search visibility across prompts, platforms, and competitors. It shows where your brand appears, where it gets cited, and where competitors outrank you before you invest in content, PR, or answer engine optimization.
That baseline matters because AI answers can look better or worse for reasons that have nothing to do with market movement. If the prompt set changes, the platform mix changes, or the competitor list changes, the numbers stop being comparable. A benchmark keeps the method steady so the team can make sound decisions from the results.
This guide walks through the full workflow: define the business question, build the prompt universe, choose the right AI platforms, record a baseline, score the results, and turn the gaps into clear next actions.
For a broader definition of the outcome you are measuring, see AI visibility.
What methodology should a team document before it benchmarks?
Start by writing down the method. Because AI answers can vary by time, prompt wording, location, account context, and model behavior, document the conditions of every measurement.
Google notes that AI Mode and AI Overviews can use different models and techniques, so the responses and links they show can differ. Google’s guidance supports treating each platform as its own measurement lane.
Set the rules before you collect the first response. Define the country, language, platforms, sampling window, prompt wording, named competitors, and how you will identify a brand mention.
Decide whether an exact brand name, product name, or clear alias counts. Keep the full response, cited URLs when available, timestamp, and prompt version.
This record makes later comparisons much more useful. It also keeps a short-term output change from becoming a false performance story.
What should an AI search benchmark measure?
Begin with one business question. A B2B SaaS team might ask, “Do buyers see us when they ask for a platform that solves our core use case?” That question sets the category, buyer stage, and competitor set.
Use a small group of measures that can guide a decision. The scorecard later in this article defines each one and its formula. Two are worth separating now, because teams routinely collapse them.
A mention puts your brand name in the answer. A citation rate measures how often those answers also cite a source on a domain you own. An answer can do the first without the second, and a brand with strong mentions and weak citations has a different problem from one with neither.
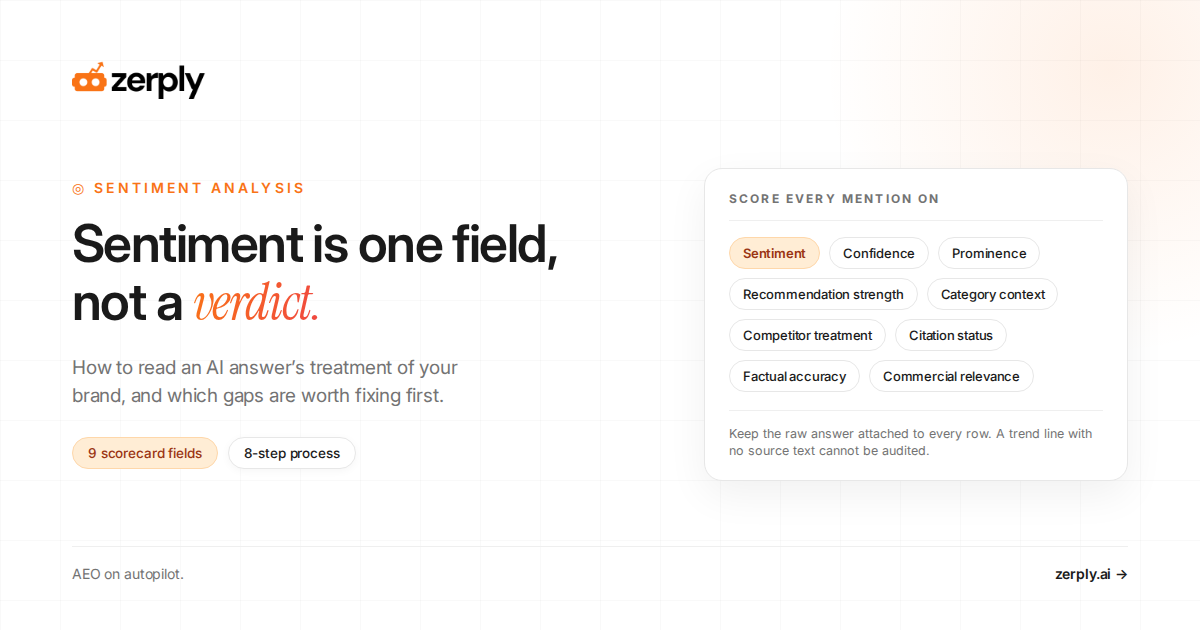
Prompt coverage is the share of priority prompts with a valid recorded result. AI share of voice is your share of tracked brand mentions within the defined sample. Brand sentiment records whether the answer describes your brand in a favorable, neutral, unfavorable, or inaccurate way.
A visibility gap is the difference between your result and a comparator that matters commercially. The comparator can be a competitor, a platform, a prompt group, or a threshold your team sets. Naming which one you mean is the difference between a finding and an observation.
Which prompts and platforms belong in an AI search benchmark?
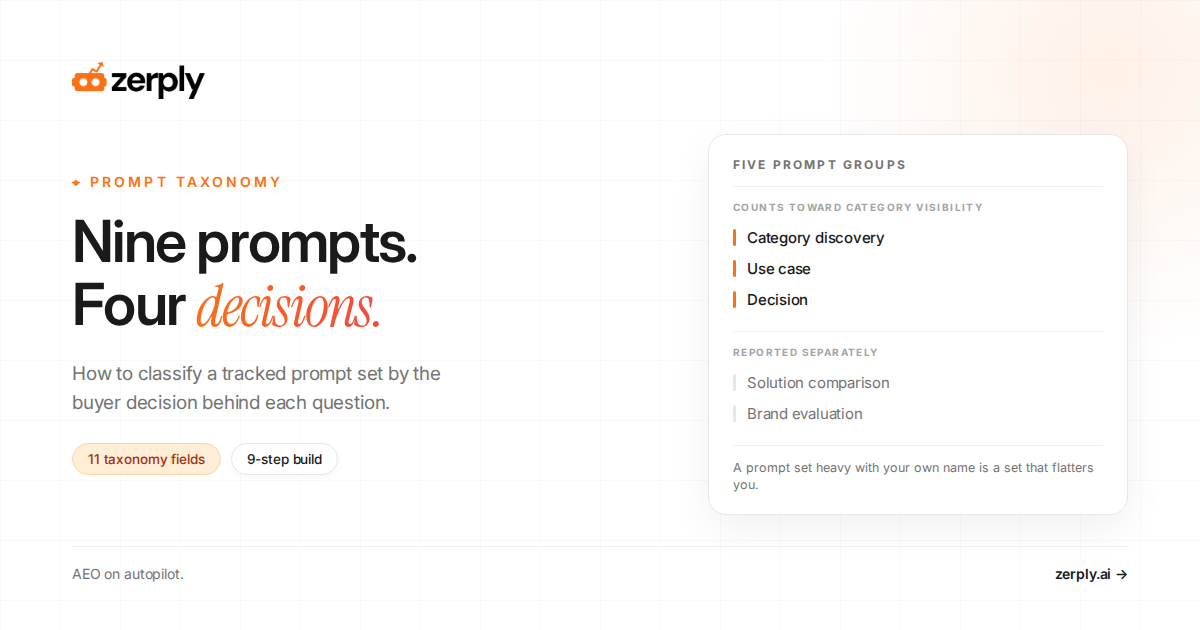
Build a focused prompt universe around real buyer questions. Use four groups and keep them separate.
| Prompt group | What it reveals | Illustrative prompt |
|---|---|---|
| Category | Whether you appear when buyers first learn the market | “What are the best AI visibility platforms for B2B teams?” |
| Use-case | Whether you are tied to a specific job to be done | “How can a marketing team monitor AI citations?” |
| Comparison | Whether you appear during evaluation | “Compare Brand A and Brand B for AI visibility tracking.” |
| Branded | How accurately AI describes your company | “What does NorthstarOps do?” |
All prompts in this table are illustrative.
Start smaller than the NorthstarOps example if your program is new.
In our guide to AI search prompt tracking, a defensible starting range is roughly 15 to 25 prompts for an early-stage program, 25 to 40 for a focused category program, 50 to 100 for a multi-product business, and 100 to 250 or more for an enterprise or agency portfolio. A first benchmark of 40 prompts across three platforms is a day of collection rather than an afternoon. The recurring run is faster because the method is already written.
One blended score can hide the gap that matters. Your brand may lead on branded prompts because the model recognizes your name, then disappear from category and comparison prompts where new buyers make a shortlist. Separate reporting helps with clarity here.
Choose platforms based on where your buyers research, the category you serve, and the country you need to measure. If you track ChatGPT, Claude, Gemini, Google AI Mode and AI Overviews, and Perplexity, keep each result distinct before you aggregate it. A platform that does not show citations should not be scored as if it does.
| Platform | Shows source citations | Notes for scoring |
|---|---|---|
| ChatGPT | Varies | Citations appear when ChatGPT runs web search and opens a Sources view. Responses that do not use web search may show no sources, so score citation rate only on source-visible answers. |
| Claude | Varies | Web search responses include direct citations and source links. Workspaces without web search, or answers that do not invoke it, may show no sources. |
| Gemini | Varies | Gemini Apps shows a Sources panel when links are available. Some answers include no sources, and links can point to public web pages, uploaded files, or connected Workspace content. |
| Google AI Overviews | Yes | AI Overviews shows summary links to supporting sites. Keep it separate from AI Mode because Google says the models and links can differ. |
| Google AI Mode | Yes | AI Mode provides helpful links to explore the web and continue with follow-up questions. Score it separately from AI Overviews. |
| Perplexity | Yes | Perplexity returns cited answers with numbered source links by default. Keep answer-level rules fixed because source counts can vary by mode. |
Metrics that depend on citations can only be scored on the platforms in the yes column, and a blended citation rate across all platforms is not a real number.
The same discipline applies to competitors. Include direct alternatives that buyers compare, plus one category leader if it shapes buyer expectations. A short, stable list is more useful than a long list that changes every month. For a related operating model, see how to monitor competitor visibility across AI answer engines.
Make your brand more visible in AI search
Understand where you appear, where competitors win, and what to improve next.
How do you capture a defensible baseline and keep it disciplined?
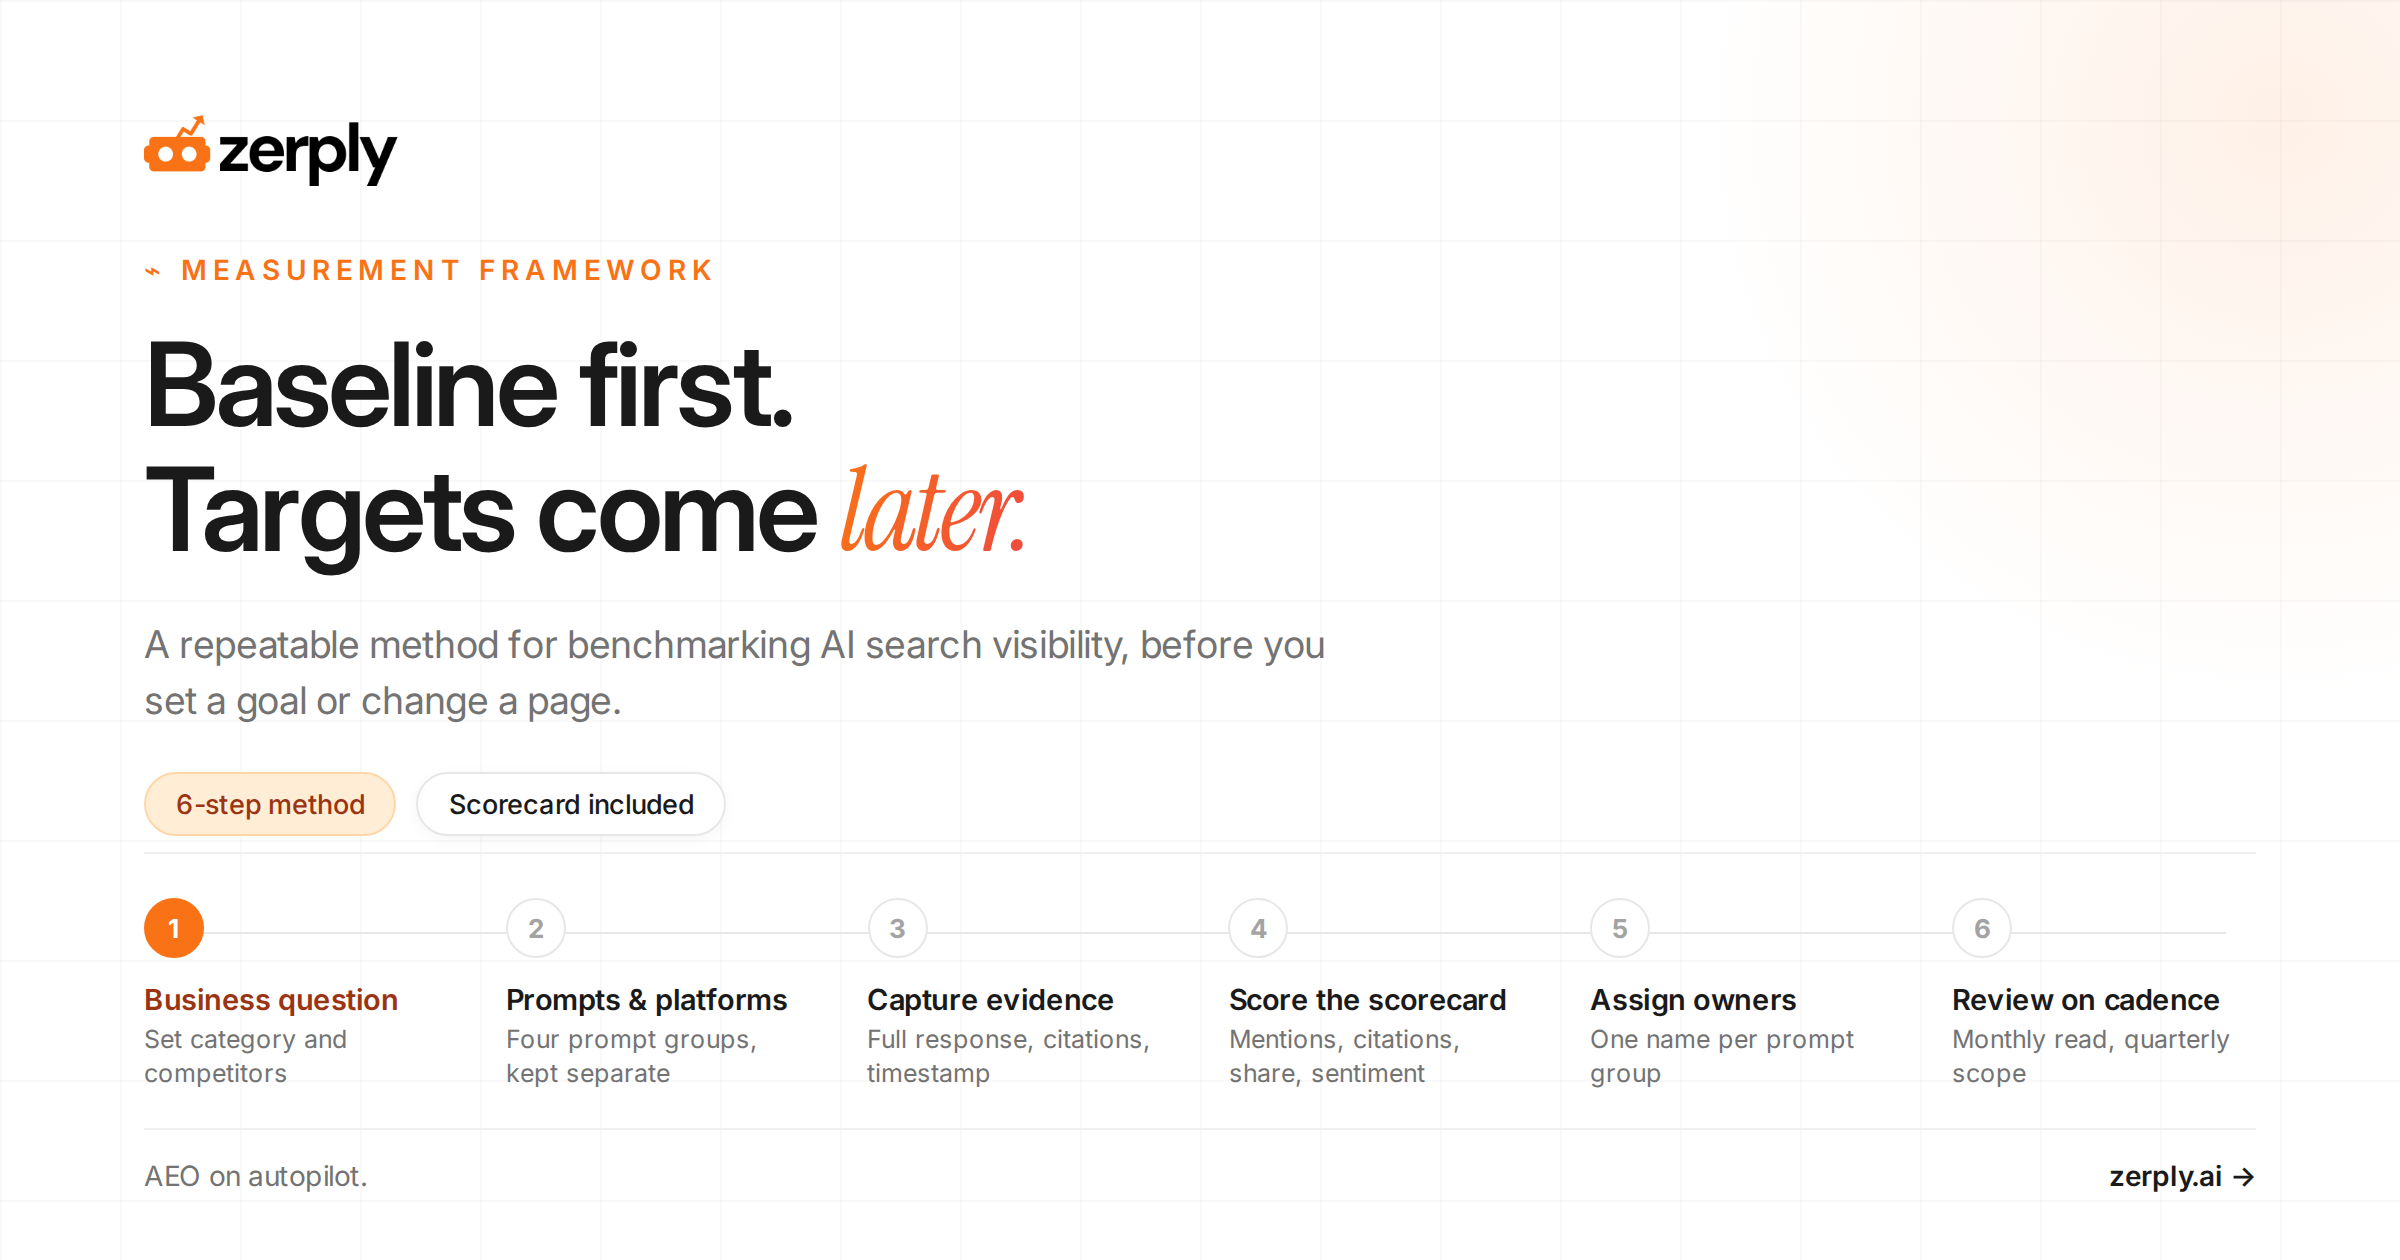
Use the same workflow every time, and write it down before the first run rather than after.
Benchmark checklist
- Set scope: Write the business question, audience, country, language, and measurement period.
- Choose platforms: Select only the AI answer engines relevant to that scope.
- Create a prompt set: Tag each prompt as category, use-case, comparison, or branded.
- Identify competitors: Freeze a focused list and document any later changes.
- Record a baseline: Save the complete answer, sources, timestamp, platform, and prompt version.
- Define metrics: State formulas, scoring rules, and which metrics are unavailable on a platform.
- Assign owners: Name an analyst for measurement and an owner for every resulting action.
- Set review cadence: Schedule an operating check, a deeper review, and a scope review.
Measurement discipline protects the baseline. Fix the collection method before comparing periods. Retain raw response evidence instead of only dashboard totals. Annotate major content releases, product changes, rebrands, PR activity, and measurement changes.
Finally, do not treat one platform response as a market-wide conclusion. A benchmark is a sample of defined questions under defined conditions. It is more of a decision support, and not a census of everything an AI system can say.
How do you create and use a useful AI search scorecard?
A scorecard turns stored responses into decisions. Use the same columns for every metric: metric, definition, baseline value, target or threshold, why it matters, and recommended action. Each team sets its own threshold. There is no universal standard to borrow.
For reproducibility, count one mention per tracked brand per answer, even when the brand appears more than once.
For share of voice, divide those answer-level mentions by the total answer-level mentions for the tracked brands.
For average prominence, score the first named brand as 5, second as 4, third as 3, later mentions as 2, and a missing brand as 0.
Apply the same rule to ranked lists and prose answers by reading the first clear brand introduction as position one.
| Metric | Definition | Baseline value | Target or threshold | Why it matters | Recommended action |
|---|---|---|---|---|---|
| Prompt coverage | Priority prompts with a recorded result ÷ total priority prompts | Record % | 100% of agreed scope | Shows whether the benchmark is complete | Fill missing platform or prompt results before analysis |
| Mention rate | Answers that name the brand ÷ eligible answers | Record % | Team-set threshold by prompt group | Measures basic presence | Review gaps in high-value category and comparison prompts |
| Citation rate | Answers citing an owned domain ÷ answers where sources are available | Record % | Team-set threshold by platform | Shows source-level inclusion | Improve or refresh the page tied to lost or missing citations |
| Share of voice | Brand mentions ÷ all tracked-brand mentions | Record % | At or above priority competitor | Shows relative category visibility | Focus on prompt groups where the gap is commercially meaningful |
| Average prominence | Mean position score under a fixed rule: first mention = 5, second = 4, third = 3, later mention = 2, unranked or absent = 0 | Record score | Team-set rule | Shows whether you are the answer or an alternative | Improve the supporting evidence and clarity for lagging prompts |
| Sentiment | Coded favorable, neutral, unfavorable, or inaccurate language | Record distribution | No unfavorable or inaccurate pattern in priority prompts | Protects brand narrative | Correct source gaps or publish clear factual pages |
| Competitor gap | Your selected metric minus the comparator metric | Record delta | Close high-priority gaps | Identifies where a rival wins | Assign a content, PR, or product-marketing response |
| Trend direction | Change from the comparable prior period | Up, flat, or down | Stable or improving after a documented action | Adds context to the baseline | Investigate material shifts with raw response evidence |
Illustrative example, not observed platform data
The following fictional scorecard is for NorthstarOps, a fictional B2B SaaS company.
| Metric | Definition | Baseline value | Target or threshold | Why it matters | Recommended action |
|---|---|---|---|---|---|
| Prompt coverage | Recorded priority prompts | 48 of 50, illustrative | 50 of 50 | Two missing results weaken comparison | Complete the two records |
| Mention rate | Eligible answers naming NorthstarOps | 28%, illustrative | 40% on comparison prompts | Buyers may not see it in evaluation | Build comparison pages for the two highest-value gaps |
| Citation rate | Source-visible answers citing NorthstarOps pages | 12%, illustrative | 20% on use-case prompts | Owned pages are rarely used as sources | Refresh the practical implementation guide |
| Share of voice | Share of tracked mentions | 18%, illustrative | Within 10 points of leader | Leader has 37%, illustrative | Study leader-owned prompt groups and cited sources |
| Average prominence | Fixed 0 to 5 position score | 2.6 of 5, illustrative | 3.5 of 5 | The brand appears late in lists | Strengthen direct definitions and proof on priority pages |
| Sentiment | Favorable, neutral, unfavorable results | 6%, 84%, 10%, illustrative | No repeated unfavorable pattern | A pricing concern appears in comparisons | Give product marketing an evidence-backed correction brief |
| Competitor gap | NorthstarOps minus leader share of voice | -19 points, illustrative | Close the category-prompt gap first | Gap is widest at early research stage | Create category education content with clear use cases |
| Trend direction | Period-over-period direction | Flat, illustrative | Improving after action | No baseline movement yet | Recheck after the next comparable window |
NorthstarOps should not start with every row.
The low comparison-prompt mention rate and the 19-point category gap point to an awareness and evaluation problem. The 12% citation rate on use-case prompts suggests a second action: improve the implementation guide that should answer those questions.
The unfavorable pricing theme needs a separate factual review. Those are three owned actions with very clear evidence, rather than just a generic push to “improve AI visibility.”
Is a 28% mention rate good?
There is no clear answer to that, and you should be mindful of anyone who offers one.
Mention rates do not travel between prompt sets. A benchmark built from ten branded prompts and one built from fifty category prompts will report very different numbers for the same brand on the same day, and neither is wrong. Change the competitor list and share of voice moves without anything happening in the market. Change the platform mix and every figure moves again.
This is why published industry averages for AI visibility are worth so little. A category benchmark describes the prompt set its publisher chose, on the platforms they tracked, in the market they measured. It is a fact about their sample.
The only comparison that holds is yours, against your own method, over time. That is the whole argument for writing the method down before you collect anything. NorthstarOps at 28% is neither good nor bad. It is the number to beat next quarter, under the same rules.
We build tracking software, so this may sound counterintuitive. It is still the honest answer, and it fits the article’s main point: document the method before you start measuring.
How should teams read results and act after the baseline?
Read from narrow to broad. First, inspect the response evidence for a high-priority prompt group on one platform. Then compare that group with the same group on other platforms. Only after that should you look at a total score.
Prioritize a gap when three conditions meet: the prompt maps to a valuable buyer question, the gap is material against the right comparator, and the team can take a credible action. The action may be a page refresh, a new comparison asset, an accuracy correction, stronger source material, or a product-marketing brief.
Zerply's AI Visibility Tracking runs this method on a schedule across any four of seven supported engines, with Claude available on Enterprise. The platform-level separation this article argues for is how the product reports by default, so prompt groups stay readable rather than collapsing into one number.
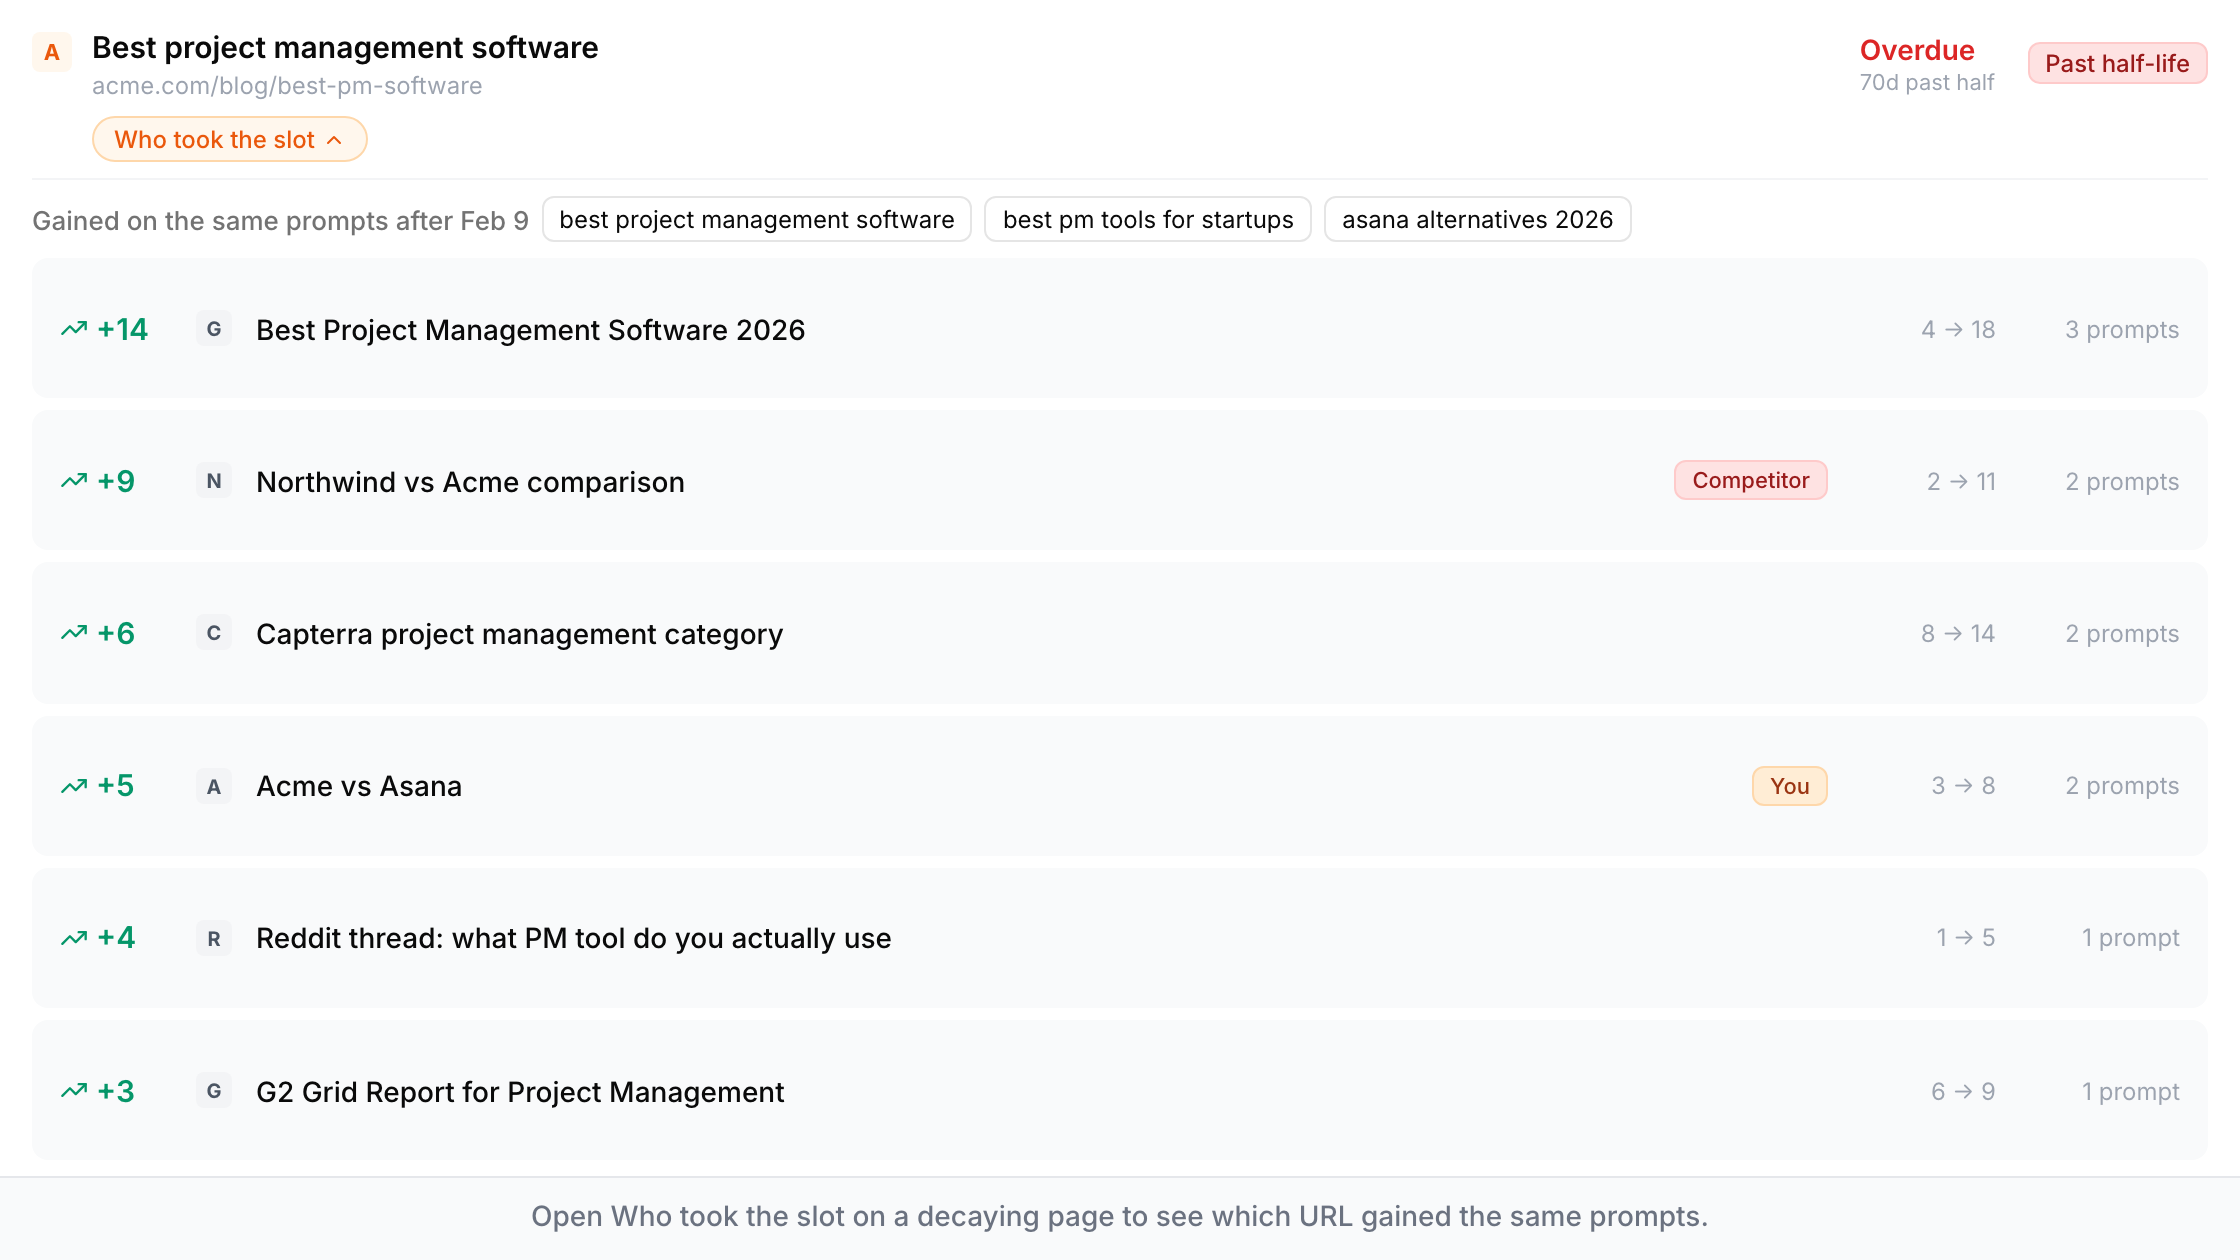
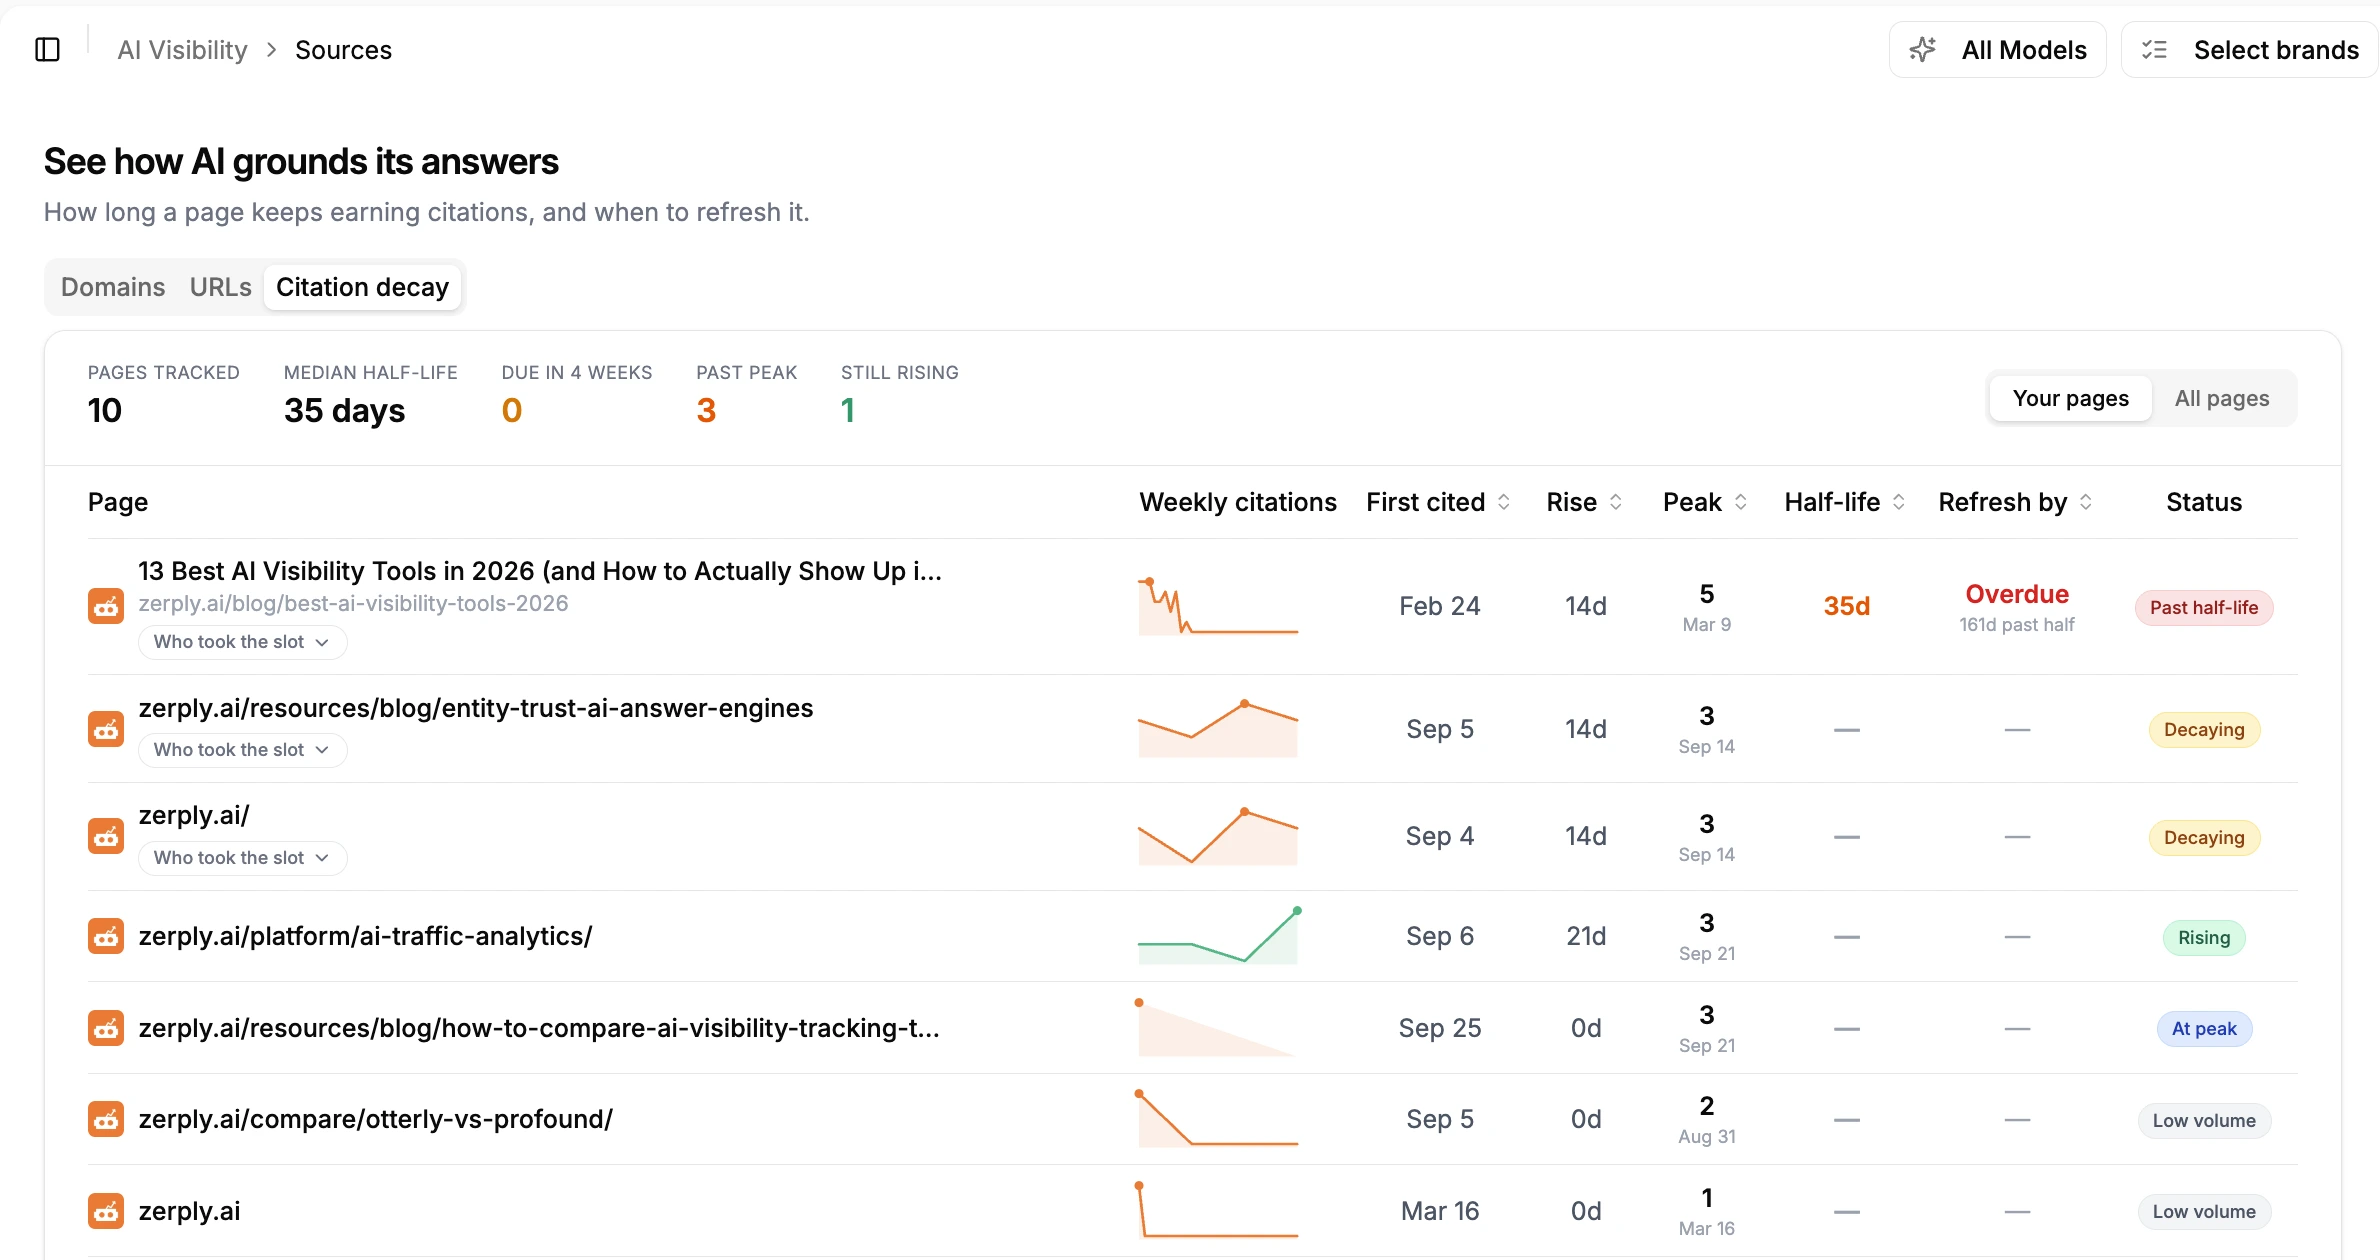
Its Citation Decay view shows how citations change over time and which URLs gained citations after a page peaked. Foundry, a $25/month add-on covering 500 pages, can then move an approved content gap into a drafting workflow.
If your team needs a repeatable way to make this review operational, start by setting a small, stable benchmark scope in Zerply before expanding coverage.
Know where your brand stands in AI
Monitor your visibility across ChatGPT, Google AI Overviews, Gemini, and more.
How often should teams update an AI search benchmark?
Set cadence by the speed of your category and the cost of being wrong. High-stakes comparison or reputation prompts may need a frequent operating check. A monthly review works well for reading patterns, deciding actions, and recording annotations. Use a quarterly scope review to revisit platforms, competitors, and prompts without rewriting the baseline every week.
Do not change the prompt taxonomy mid-period unless you document the change. Add new prompts as a new version or report them separately until they have enough history.
Conclusion
The goal of benchmarking is to give teams a stable starting point for smarter AI-search decisions, not to create another dashboard score to chase. A documented method, focused prompt groups, platform-level evidence, and clear owners turn AI search measurement into a practical operating rhythm.
Establish the baseline first. Then make changes you can explain, prioritize, and measure against the same standard.
See how your brand shows up in AI search
Track visibility, citations, prompts, and competitors across leading AI platforms.
Frequently asked questions
What is the difference between an AI search benchmark and an AI visibility goal?
A benchmark records your starting position under a fixed method. A goal is the improvement threshold your team sets after it understands that baseline.
What counts as a mention versus a citation?
A mention is a brand name in an AI answer. A citation is a displayed source link or reference to your owned domain when the platform makes sources available.
How many prompts should a team start with?
A practical starting range is about 15 to 25 prompts for an early-stage program, 25 to 40 for a focused category program, 50 to 100 for a multi-product business, and 100 to 250 or more for an enterprise or agency portfolio. The right set is the one your team can collect and review under one fixed method.
Can one score compare every AI platform?
Use a blended score only as a summary. Review platform-level results first, and calculate citation rate only on platforms that actually show sources.
How often should a team re-benchmark?
Use a cadence that matches category volatility. Many teams use a monthly review for patterns and actions, plus a quarterly scope review while keeping the measurement method stable between comparable periods.
Written by
Founder at Zerply.ai & Wittypen
Anshul is the founder of Zerply.ai and previously built Wittypen, a content marketplace powering SEO growth for 1,000+ businesses. Over the last decade he has worked hands-on with B2B SaaS and tech teams to turn search data into compounding organic growth. At Zerply he shares practical playbooks on AEO, AI visibility, and modern SEO that come directly from experiments, wins, and failures in real projects.