8 AI Visibility Metrics That Actually Matter

Traditional SEO reporting shows you impressions, rankings, and clicks. It does not tell you whether an AI answer recommends your company, cites your content, or describes your product correctly before a buyer ever visits your site.
That gap matters because more B2B software research now happens inside AI answers. If your team only tracks classic SEO metrics, you can miss high-intent questions where competitors are being recommended and your content is being ignored.
This article gives you a practical scorecard for fixing that. You will learn which eight AI visibility metrics to track, how to calculate each one, what each metric actually tells you, and what action it should trigger across content, positioning, and demand generation.
Start with one measurement unit
Before you compare results, decide what exactly you are counting.
The clearest unit is an answer observation. That means one recorded answer for one exact prompt, for one persona, in one country, on one platform, on one date, using one model or configuration. If any of those details change, you are looking at a different observation.
A simple example helps. If you ask ChatGPT, “What are the best AI visibility tools for enterprise SEO teams?” for a US-based SEO lead today, that is one observation. If you run the same prompt tomorrow, switch the persona to a content marketer, or test it in Perplexity instead, each result becomes a separate observation.
This matters because AI answers are not stable rankings in the way search result pages are. They change wording, combine sources, and show citations differently across platforms. The GEO paper argues for explainable, multi-dimensional visibility measurement rather than treating rank as the whole story.
To keep reporting clean, lock a core panel in place. Keep the same prompt set, platforms, countries, competitor set, and qualification rules for month-over-month reporting. You can test new prompts in a separate exploratory panel, but do not mix them into your core benchmark and call it a trend.
The same rule applies to screenshots. One AI Overview, AI Mode answer, or ChatGPT response is evidence of that answer on that date. It is not a trend on its own. Google notes that AI Overviews and AI Mode can use different models and techniques and may show different link sets, so Google’s guidance supports measuring a governed set of answer observations instead of relying on isolated examples.
Also separate brand visibility from source visibility. Brand visibility means the answer names your company. Source visibility means one of your pages was used or cited, even if the brand is not named.
Those signals tell you different things. A cited page without a brand mention suggests your content is useful, but the answer is not building recognition for the company. A brand mention without a citation suggests the model knows your brand, but it is not relying on your own pages as evidence.
The 8 AI visibility metrics that matter
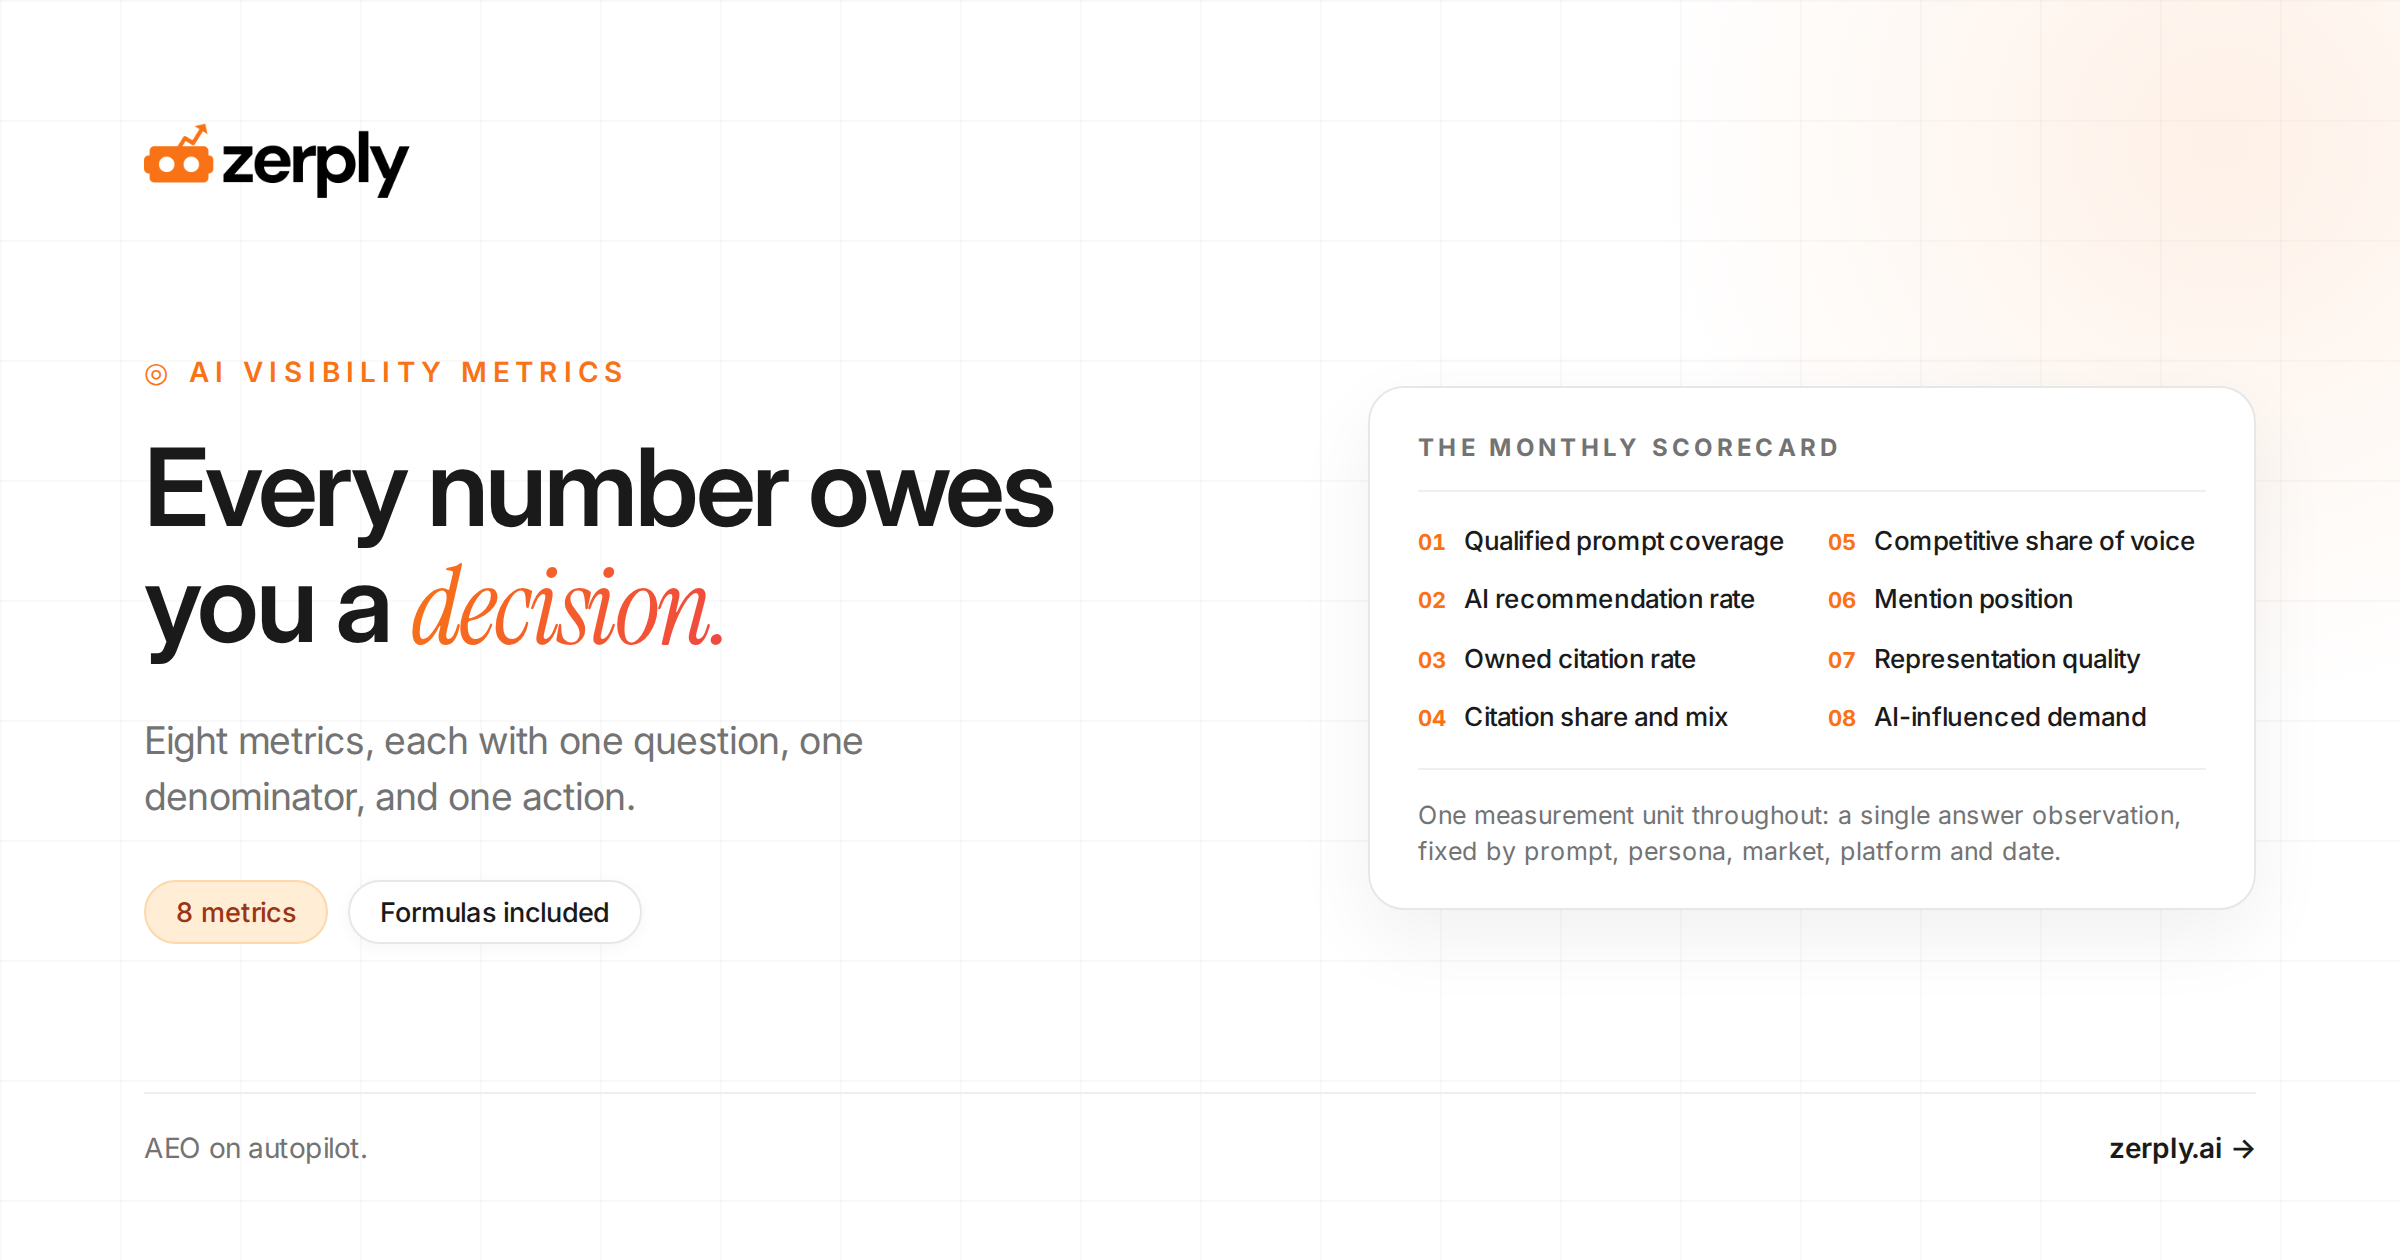
Each metric answers one question, has a clear denominator, and points to one decision. Definitions, worked examples, and action guidance follow.
| # | Metric | What it answers | Formula | Decision it drives |
|---|---|---|---|---|
| 1 | Qualified prompt coverage | Are we present for the buyer questions that matter? | Prompts with a qualified brand appearance ÷ priority prompts tested × 100 | Where we need to be present |
| 2 | AI recommendation rate | Does the answer actively shortlist us? | Answer executions with a qualified recommendation ÷ eligible answer executions × 100 | Where positioning and proof need work |
| 3 | Owned citation rate | Is our content treated as a source? | Answer executions citing at least one owned URL ÷ eligible answer executions × 100 | Which pages need to become citable |
| 4 | Citation share and source mix | How much of the source landscape do we own? | Citations to owned URLs ÷ all citations in the tracked corpus × 100 | Which asset to refresh or create next |
| 5 | Competitive AI share of voice | Are we winning relative to a named competitor set? | Qualifying mentions of your brand ÷ qualifying mentions of all tracked brands × 100 | Which competitive themes to contest |
| 6 | Mention position and answer prominence | How visible are we when we do appear? | Prominence points ÷ (5 × prominence-eligible answers) × 100, or average list position within a platform | Whether to defend a position or enter a new one |
| 7 | Representation quality | Is AI describing us accurately? | Accurate qualified mentions ÷ all qualified mentions × 100 | What misinformation to correct first |
| 8 | AI-influenced demand | Is visibility producing qualified pipeline? | New opportunities with AI-assisted or self-reported AI discovery ÷ all new opportunities × 100 | Where to fund the next cycle of work |
1. Qualified Prompt Coverage
Definition and formula
Qualified prompt coverage is the percentage of priority buyer prompts where your brand makes a relevant appearance.
Qualified prompt coverage = prompts with a qualified brand appearance ÷ priority prompts tested × 100
The word qualified matters here. A company name mentioned in an irrelevant aside should not count. A relevant inclusion in a shortlist, direct answer, or comparison should count.
Segment by funnel stage, persona, and platform
A B2B SaaS prompt set should reflect how a buying committee researches: category prompts such as “best AI visibility platforms,” comparison prompts, implementation questions, integration questions, and problem-led prompts.
Tag every prompt by funnel stage, persona, product area, and business priority. Then review coverage by platform instead of averaging everything together. A useful starting point is to look at which questions and platforms AI visibility tools are built to monitor, then narrow that list to the questions your buyers actually ask.
For example, appearing in 36 of 60 high-priority prompts gives you 60% coverage. That may sound strong until segmentation shows 80% coverage for broad awareness prompts and only 15% for late-stage comparison prompts from an enterprise SEO lead. That second number is where the commercial risk is.
Decision it supports
Use coverage to decide where you need to be present. Sort missing prompts by business value and competitor gap. Then improve the most relevant category, use-case, comparison, implementation, or proof content first. That is usually a better roadmap than publishing more content around a topic you already cover well.
2. AI Recommendation Rate
Definition and formula
AI recommendation rate measures how often an eligible answer explicitly recommends your brand or includes it in a relevant shortlist.
AI recommendation rate = answer executions with a qualified recommendation ÷ eligible answer executions × 100
This metric is stricter than raw brand mentions. A mention can be neutral, outdated, or incidental. A recommendation ties your brand to the reader’s need.
Qualification rules
Create a simple taxonomy and apply it consistently. Count a direct recommendation when the answer proposes your product for the stated job. Count a qualified shortlist when it includes you among realistic options. Classify a neutral factual reference separately, and exclude irrelevant or ambiguous name matches.
If a prompt is run repeatedly, use the execution-level result. Ten recommendations across 40 eligible runs is a 25% recommendation rate, even if the brand name appears 18 times in total. That prevents repeated references inside one answer from inflating the metric.
Action when coverage is high but recommendation is low
High coverage with low recommendation usually means answer engines recognize the entity but do not connect it to a strong buying case. Review how clearly your site explains audience fit, category, differentiators, integration depth, and proof. Then look beyond your own site, because answer engines also absorb reviews, partner pages, expert commentary, and comparison content.
3. Owned Citation Rate
Definition and formula
Owned citation rate is the percentage of eligible answer executions that include a citation or source reference to a page on your domain.
Owned citation rate = answer executions citing at least one owned URL ÷ eligible answer executions × 100
Use this metric to find the pages that should be treated as evidence but are not. It is a source-selection diagnostic, not a count of how often your brand name appears.
Diagnose the mention-to-citation gap
Read three patterns together. Mentioned, not cited suggests category recognition but weak on-site evidence, so pages explaining claims, use cases, and implementation may need work. Cited, not mentioned suggests useful background content but weak brand recognition, so the company, product, and value proposition may need to be clearer. Neither mentioned nor cited is only worth chasing after you confirm the prompt actually matters.
Content and technical actions to earn citations
Build pages that deserve to be sources: original research with transparent methods, definitive product documentation, clear comparison criteria, current integration guidance, and concise answers to difficult buyer questions. Authority work should make those assets more useful and more credible, not just more numerous. This explanation of AI source authority is a good reference for the content, technical, and external signals worth reviewing.
There is no special technical shortcut for Google AI features. Google says a supporting link must be indexed and eligible to appear with a Search snippet, with no extra technical requirements beyond normal SEO foundations. Its recommendations still include crawlability, internal links, page experience, textual content, and accurate structured data.
4. Citation Share and Source Mix
Definition and formula
Owned citation rate tells you whether you earn a source slot. Citation share tells you how much of the source landscape you own across the answer set.
Citation share = citations to owned URLs ÷ all citations in the tracked answer corpus × 100
If answers contain 400 citations in a month and 28 point to your domain, citation share is 7%. Keep the numerator and denominator at the URL level where possible, because one answer may cite several pages.
Read the source mix
The percentage is only the starting point. Report which owned URLs are cited, the content types they represent, the external domains most frequently cited, and whether citations are concentrated in one aging page. A 10% citation share driven by one glossary page is less durable than 8% spread across product documentation, expert guides, customer evidence, and original research.
Review competitor sources too. If independent publications repeatedly support a competitor’s category claims, a new blog post on your own domain may not close the gap. You may need stronger evidence, a clearer narrative, or more credible third-party validation. This guide to AI SEO tools gives useful context for connecting visibility insights to sourceable content.
Decision it supports
Use source mix to decide which asset to refresh or create next. Protect pages that already carry citation share, update pages that have gone stale, and fill missing subtopics where competitor-owned sources dominate.
5. Competitive AI Share of Voice
Definition and formula
AI share of voice shows your relative presence against a defined competitor set.
AI share of voice = qualifying mentions of your brand ÷ qualifying mentions of all tracked brands × 100
Share of voice is comparative, while visibility is the absolute rate at which you appear. For a fuller explanation of the term and its limits, see the AI visibility glossary entry.
Keep comparisons valid
The denominator changes whenever you add competitors or prompts. Preserve a fixed core benchmark for trend reporting using the same priority prompts, platforms, locale, and qualification criteria. You can keep an exploratory benchmark as well, but do not present its movement as a like-for-like trend.
A useful view is share of voice by prompt theme. A 12% overall score could hide 35% share in content optimization prompts and 2% share in AI visibility tracking prompts, where an adjacent competitor owns the conversation.
Interpret absolute visibility alongside relative leadership
Never read share of voice on its own. A company can lead a tiny, low-value answer set and still miss important buyer questions. On the other hand, 40% qualified prompt coverage with 8% share of voice can signal a competitive category where the brand is present but not dominant. Put coverage and share of voice side by side, then prioritize themes with high business value and a recoverable competitor gap.
6. Mention Position and Answer Prominence
Definition and formula
Mention position records where a brand appears in a ranked list. Answer prominence captures its narrative role when no meaningful list position exists. Use one convention across reporting periods, and keep platform-level detail because answer layouts differ.
Prominence score = brand prominence points ÷ (5 × prominence-eligible answers) × 100
This is a suggested convention, not an industry standard. Assign five points for a lead recommendation, three for a viable alternative, one for a passing reference, and zero when absent. Whatever weighting your team chooses should stay constant across reporting periods.
List position versus narrative prominence
In a ranked list, report the brand’s average position when it appears. Lower is better. Being first in a “best tools” answer usually carries more weight than appearing near the end of the list. For narrative answers, use the prominence labels above. A lead recommendation explains fit and gives a reason to choose the product. A passing reference does neither.
The distinction matters because generated answers are structured rather than linear result pages. The foundational GEO research describes visibility as multi-faceted, including citation position and influence, rather than reducible to one average rank. Aggarwal et al. give the clearest rationale for treating prominence as a separate, explainable layer.
Platform-specific reporting limits
Do not compare ordinal position mechanically across platforms. One answer engine may produce a three-item shortlist, another a prose comparison, and another source links without a visible ranking. Compare position and prominence within each platform first, then use a cross-platform roll-up only as directional context. Moving from absent to a viable alternative on a high-intent prompt can matter more than holding first place in a low-intent list.
7. Representation Quality
Accuracy and sentiment formulas
The most overlooked AI visibility metric is whether the answer says the right thing. Measure accuracy separately from sentiment.
Accuracy rate = accurate qualified mentions ÷ all qualified mentions × 100
For sentiment, report the distribution of positive, neutral, and negative qualified mentions. A platform-level sentiment score can help surface trends, but every important claim should still be reviewable at the answer level.
Error taxonomy
Give analysts a controlled error taxonomy. For B2B SaaS, the most useful categories are outdated product claims, wrong audience fit, missing qualifiers, incorrect pricing or packaging, bad integration or security information, and confusion with a competitor. Record the prompt, platform, answer excerpt, severity, source links, and responsible team.
The key point is simple: positive misinformation is still misinformation. “Best platform for large enterprises” is not a win if the product is not positioned or equipped for that audience. A neutral answer that accurately names a product’s ideal use case can be far more useful commercially.
Escalation and correction workflow
Treat recurring errors as a content-governance queue. Product marketing should own approved positioning. Product or security teams should validate claims. SEO and content teams should update the canonical pages that explain them. Then retest after those pages can be recrawled. This turns answer monitoring into an early warning system rather than a vanity dashboard.
8. AI-Influenced Demand
Definition and formula
AI-influenced opportunity rate measures the share of new opportunities with evidence that AI-assisted discovery played a role.
AI-influenced opportunity rate = new opportunities with AI-assisted or self-reported AI discovery ÷ all new opportunities × 100
State the attribution limit plainly. AI answer interactions are often zero-click, platforms expose limited referral data, and no single mention can usually be tied to a specific visit. This metric measures evidence of influence, not proof of direct causation.
Tiered evidence, strongest first
Use a tiered evidence model. The strongest evidence is AI-referred sessions and conversions where the referrer is captured. Next come assisted conversions in multi-touch reporting, followed by CRM self-reported source from a “How did you hear about us?” field that includes an AI assistant option.
Branded search growth after visibility gains is a weaker directional signal, as are demo or trial requests from pages known to be cited. Each signal is useful, but none should be turned into a claim of deterministic attribution.
Add the AI assistant option to the source field, including the assistants most relevant to your market. Keep an annotation log of major content, PR, product, and tracking changes. That log helps teams read correlation honestly, because a rise in branded search may follow better answer visibility, a launch, a PR campaign, or all three.
Google confirms that traffic from its AI features is included in Search Console’s Web reporting and recommends evaluating engagement and conversions in analytics, while still requiring careful interpretation. Google’s documentation is clear about the measurement foundation, but it does not offer a perfect attribution method.
Decision it supports
Investment should go to prompt clusters where three conditions overlap: commercial intent, a recoverable visibility gap, and evidence of downstream demand. Compare conversion quality, not session volume. If a cluster produces little identifiable traffic but is repeatedly named in self-reported discovery on qualified opportunities, it may deserve more attention than a higher-volume referral source with poor fit.
Build a monthly AI search performance scorecard
Start with 50 to 100 governed prompts, not thousands of unprioritized variants. Include category, alternative, comparison, use-case, implementation, and objection prompts. Tag each by funnel stage, persona, topic, market, priority, and owner. Set a fixed core competitor set and a documented rule for what counts as a qualified mention, recommendation, and citation.
Review the panel weekly for material changes or representation errors. Then hold a monthly decision review where SEO, content, product marketing, and demand teams inspect all eight numbers: qualified prompt coverage, recommendation rate, owned citation rate, citation share and source mix, AI share of voice, prominence, representation quality, and AI-influenced demand. Attach an action and an owner to each material movement. The table below is an operating subset, not a replacement for the full scorecard.
| Metric | Monthly question | Typical action |
|---|---|---|
| Qualified prompt coverage | Where are we absent? | Build or upgrade the missing answer asset. |
| AI recommendation rate | Where are we known but not shortlisted? | Strengthen positioning, proof, and comparative fit. |
| Owned citation rate | Where is our expertise not sourced? | Improve evidence, documentation, and page quality. |
| Citation share and source mix | Which pages and source gaps matter most? | Refresh vulnerable assets or create the missing evidence. |
| AI share of voice | Where do competitors own high-value conversations? | Focus authority and comparison work on the gap. |
| Mention position and prominence | Where are we visible but secondary? | Defend strategic leadership or sharpen category framing. |
| Representation quality | What misinformation is recurring? | Correct canonical content and escalate claim validation. |
| AI-influenced demand | Which visibility themes show downstream value? | Fund work where commercial intent and qualified demand overlap. |
The operational value comes from connecting answer-side diagnosis to execution. Zerply’s Unified AEO Tracking classifies stance and context role, which supports prominence labels and accuracy review without manual answer capture. Its Foundry publishing layer can publish schema-rich pages to a subpath on your domain, giving coverage and citation gaps a direct content action instead of leaving them as dashboard findings.
Measure what changes decisions
The best AI visibility metrics are not the ones that make a dashboard look impressive. They show which valuable questions lack your brand, where your content is not used as evidence, which competitors dominate the answer, whether the representation is accurate, and where visibility shows credible downstream demand. Build the scorecard, keep the rules consistent, and use each monthly review to turn gaps into an accountable content, authority, and demand plan.
See how Zerply brings AI visibility tracking and SEO execution into one workflow. Explore the platform or start a 7-day free trial.
Frequently asked questions
What are AI visibility metrics?
AI visibility metrics quantify how often a brand appears in AI-generated answers, whether its own pages are used as sources, how prominently it features, how it compares with competitors, whether it is described accurately, and what demand it influences. They measure presence inside answers rather than rankings and clicks.
What is the most important AI visibility metric?
Start with qualified prompt coverage because it reveals whether your brand appears for the buyer questions that matter. Do not stop there: pair it with owned citation rate to see whether your content is trusted as a source, AI share of voice to understand competitive standing, and representation quality to make sure increased visibility is accurate.
What is the difference between AI brand mentions and AI citations?
An AI brand mention names your company or product in an answer. An AI citation points to a particular page or resource. An answer can mention you without citing your site, or cite your content without naming the brand; both patterns carry different diagnostic value.
What is a good owned citation rate?
There is no reliable industry benchmark, because rates vary by engine, topic, prompt type, and competitive set. Establish your own baseline from a fixed set of citation-eligible prompts, then compare by topic and against named competitors over consistent periods.
How often should B2B SaaS teams measure AI search visibility?
Monitor a stable prompt set weekly to catch material changes and factual errors. Make content, authority, and competitive-prioritization decisions monthly, using a fixed benchmark so trend changes remain interpretable.
Written by
Founder, Zerply.ai & Wittypen
Preetesh Jain is the Founder of Zerply.ai and Wittypen. He specializes in SEO, Answer Engine Optimization (AEO), AI search visibility, content marketing, and product development. Through his work building AI-powered marketing platforms, he helps businesses improve their organic presence across Google, ChatGPT, Perplexity, Claude, and other emerging discovery channels. He regularly writes about AI search, organic growth, content strategy, and the future of digital marketing.